
படிமம்:Blood values sorted by mass and molar concentration.png
மூலக்கோப்பு (6,798 × 977 படவணுக்கள், கோப்பின் அளவு: 2.46 MB, MIME வகை: image/png)
| இது விக்கிமீடியா பொதுக்கோப்பகத்தில் இருக்கும் ஒரு கோப்பாகும். இக்கோப்பைக் குறித்து அங்கே காணப்படும் படிம விளக்கப் பக்கத்தை இங்கே கீழே காணலாம்.
|
|
சுருக்கம்
| விளக்கம் |
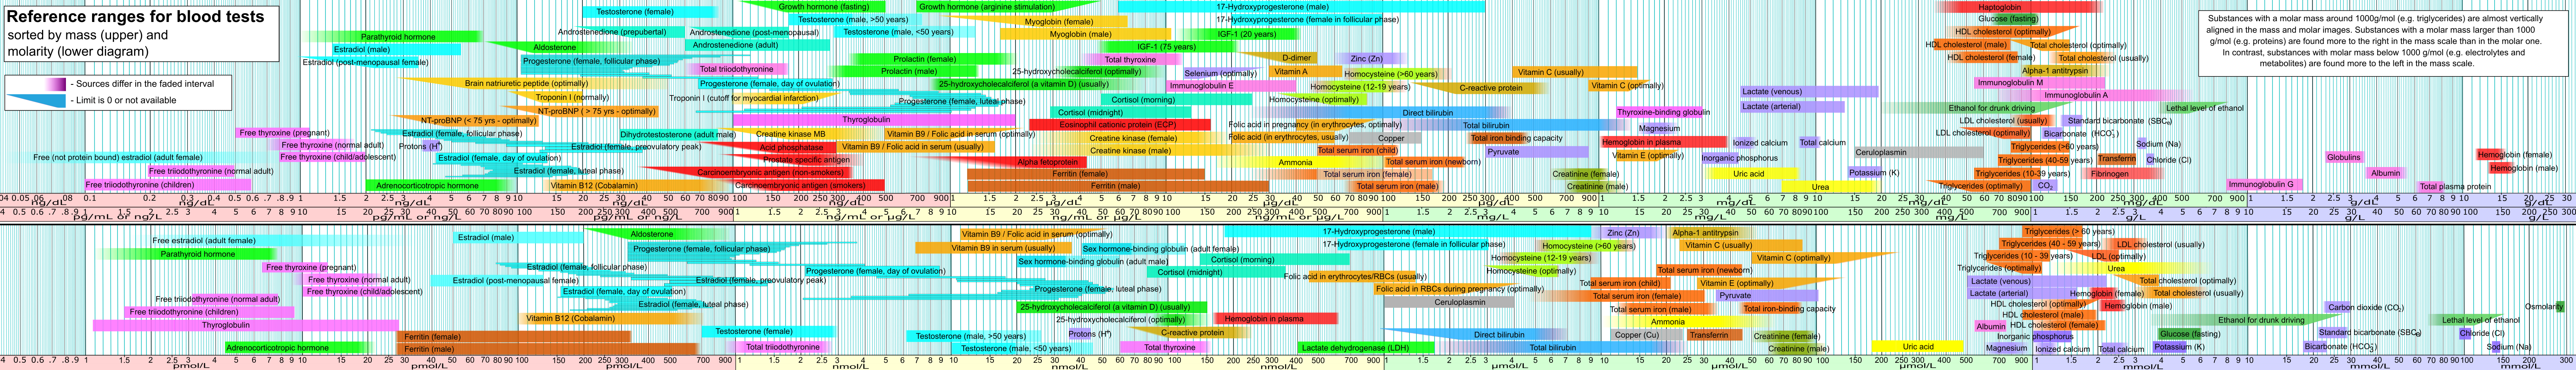
English: Reference ranges for blood tests, sorted by mass concentration and molar concentration.
ReferencesValues taken from Wikipedia article, with references and further description (or links to it) found there. Values through menstrual cycle for luteinizing hormone, follicle stimulating hormone, estradiol, and progesterone, however, are from:
Notes on individual substances
Original derivationThis image was originally created by a fusion of Image:Reference ranges for blood tests - by mass.png and Image:Reference ranges for blood tests - by molarity.png. Further informationFor more information, see article section en:Reference ranges for blood tests#Sorted by concentration. |
| நாள் | |
| மூலம் | சொந்த முயற்சி - see also "References" section above |
| ஆசிரியர் | Mikael Häggström |
Blood values gallery
|
An overview of images showing reference ranges for blood tests sorted by amount.  Compound image, showing reference ranges sorted by mass and molar concentration. This is the most updated version. If the print preview of the Internet browser doesn't display the full image, then it may have to be downloaded and opened with another program. Vector (.svg) version is available.Also a version with blank boxes is available for translation or texting in HTML/CSS instead.  Vector (.svg) version is available, but is less updated than .png-version.  Vector (.svg) version is available, but is less updated than .png-version. | ||
   |
| |

.png)
அனுமதி
| This file is made available under the Creative Commons CC0 1.0 Universal Public Domain Dedication. | |
| The person who associated a work with this deed has dedicated the work to the public domain by waiving all of their rights to the work worldwide under copyright law, including all related and neighboring rights, to the extent allowed by law. You can copy, modify, distribute and perform the work, even for commercial purposes, all without asking permission.
|
கோப்பின் வரலாறு
குறித்த நேரத்தில் இருந்த படிமத்தைப் பார்க்க அந்நேரத்தின் மீது சொடுக்கவும்.
| நாள்/நேரம் | நகம் அளவு சிறுபடம் | அளவுகள் | பயனர் | கருத்து | |
|---|---|---|---|---|---|
| தற்போதைய | 00:40, 31 மே 2021 | 6,798 × 977 (2.46 MB) | Jul059 | Lossless file size reduction | |
| 18:03, 5 சனவரி 2018 | 6,798 × 977 (2.95 MB) | Mikael Häggström | More clear separation of mass vs molarity | ||
| 09:43, 30 சூலை 2011 | 6,798 × 977 (2.68 MB) | Mikael Häggström | Added molar aldosterone. Clarified content in intro box. | ||
| 12:47, 15 ஏப்பிரல் 2011 | 4,985 × 716 (1.82 MB) | Mikael Häggström | Updated from svg version | ||
| 07:24, 29 மார்ச்சு 2011 | 4,985 × 716 (1.84 MB) | Mikael Häggström | corrected ages in IGF-1 | ||
| 07:18, 29 மார்ச்சு 2011 | 5,033 × 723 (1.88 MB) | Mikael Häggström | Added IGF-1. Updated prolactin values. | ||
| 19:26, 3 நவம்பர் 2010 | 4,791 × 667 (1.67 MB) | Mikael Häggström | removed redundant info in infobox | ||
| 14:17, 8 ஆகத்து 2010 | 4,791 × 667 (1.67 MB) | Mikael Häggström | Corrected mass sodium, added dihydrotestosterone | ||
| 15:37, 24 சூன் 2010 | 4,791 × 667 (1.68 MB) | Mikael Häggström | Removed misplaced "ethanol for drunk driving" | ||
| 06:36, 29 மே 2010 | 4,791 × 667 (1.68 MB) | Mikael Häggström | May update |
கோப்பு பயன்பாடு
பின்வரும் 3 பக்கங்கள் இணைப்பு இப் படிமத்துக்கு இணைக்கபட்டுள்ளது(ளன):
கோப்பின் முழுமையான பயன்பாடு
கீழ்கண்ட மற்ற விக்கிகள் இந்த கோப்பை பயன்படுத்துகின்றன:
- ar.wikipedia.org-திட்டத்தில் இதன் பயன்பாடு
- ast.wikipedia.org-திட்டத்தில் இதன் பயன்பாடு
- bg.wikipedia.org-திட்டத்தில் இதன் பயன்பாடு
- bn.wikipedia.org-திட்டத்தில் இதன் பயன்பாடு
- bs.wikipedia.org-திட்டத்தில் இதன் பயன்பாடு
- ca.wikipedia.org-திட்டத்தில் இதன் பயன்பாடு
- cs.wikipedia.org-திட்டத்தில் இதன் பயன்பாடு
- da.wikipedia.org-திட்டத்தில் இதன் பயன்பாடு
- el.wikipedia.org-திட்டத்தில் இதன் பயன்பாடு
- en.wikipedia.org-திட்டத்தில் இதன் பயன்பாடு
- Cholesterol
- Fat
- Testosterone
- Adrenocorticotropic hormone
- Creatinine
- Bilirubin
- Pyruvic acid
- Lactic acid
- Reference ranges for blood tests
- Calcium in biology
- Globulin
- Transferrin
- Blood urea nitrogen
- Creatine kinase
- Ceruloplasmin
- Portal:Medicine
- Serum iron
- Total iron-binding capacity
- Transferrin saturation
- Thyroid function tests
- Acid phosphatase
சிறப்பு பக்கம்-மொத்த பயன்பாடு - இதன் மூலம் இந்த கோப்பின் மொத்த பயன்பாட்டை அறிய முடியும்