
படிமம்:COVID-19 Outbreak World Map Total Deaths per Capita.svg

Size of this PNG preview of this SVG file: 800 × 406 படப்புள்ளிகள். மற்ற பிரிதிறன்கள்: 320 × 162 படப்புள்ளிகள் | 640 × 325 படப்புள்ளிகள் | 1,024 × 520 படப்புள்ளிகள் | 1,280 × 650 படப்புள்ளிகள் | 2,560 × 1,300 படப்புள்ளிகள் | 2,754 × 1,398 படப்புள்ளிகள் .
மூலக்கோப்பு (SVG கோப்பு, பெயரளவில் 2,754 × 1,398 பிக்சல்கள், கோப்பு அளவு: 1.24 MB)
| இது விக்கிமீடியா பொதுக்கோப்பகத்தில் இருக்கும் ஒரு கோப்பாகும். இக்கோப்பைக் குறித்து அங்கே காணப்படும் படிம விளக்கப் பக்கத்தை இங்கே கீழே காணலாம்.
|

|
This file may be updated to reflect new information. If you wish to use a specific version of the file without new updates being mirrored, please upload the required version as a separate file. |
சுருக்கம்
| விளக்கம் |
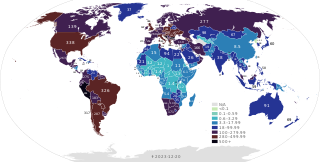
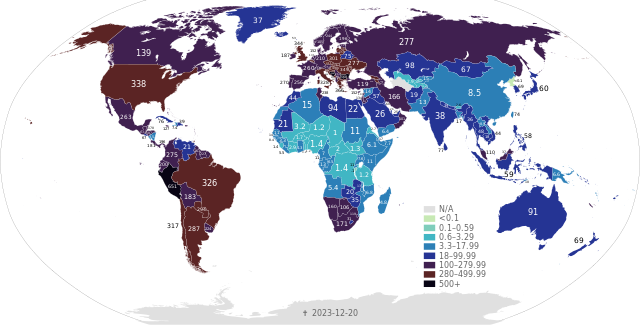
English: COVID-19 Outbreak World Map Total Reported Deaths per Capita.
500+ deaths per 100,000 inhabitants
280-499.99
100–279.99
18–99.99
3.3–17.99
0.6–3.29
0.1–0.59
<0.1
No deaths or no data
Data is from the deaths per million column at Template:COVID-19 pandemic death rates (or the expanded version here). The data is also found here. Data is converted from deaths per million to deaths per 100,000. Can be double checked against statista.com and realclearpolitics.com |
| நாள் | - Date of first upload to the Wikimedia Commons. See the file history farther down for the latest date. |
| மூலம் |
சொந்த முயற்சி; This vector image includes elements that have been taken or adapted from this file: |
| ஆசிரியர் | Dan Polansky and authors of File:BlankMap-World.svg. |
| SVG genesis | This map was created with unknown tool. |
அனுமதி
இந்த ஆக்கத்தின் காப்புரிமையாளரான நான் இதனைப் பின்வரும் உரிமத்தின் கீழ் வெளியிடுகின்றேன்:
This file is licensed under the Creative Commons Attribution-Share Alike 4.0 International license.
- நீங்கள் சுதந்திரமாக:
- பகிர்ந்து கொள்ள – வேலையை நகலெடுக்க, விநியோகிக்க மற்றும் அனுப்ப
- மீண்டும் கலக்க – வேலைக்கு பழகிக்கொள்ள.
- கீழ்க்காணும் விதிகளுக்கு ஏற்ப,
- பண்புக்கூறுகள் – நீங்கள் பொருத்தமான உரிமையை வழங்க வேண்டும், உரிமத்திற்கான இணைப்பை வழங்க வேண்டும் மற்றும் மாற்றங்கள் செய்யப்பட்டிருந்தால் குறிப்பிட வேண்டும். நீங்கள் ஏற்புடைய எந்த முறையிலும் அவ்வாறு செய்யலாம், ஆனால் எந்த வகையிலும் உரிமதாரர் உங்களை அல்லது உங்கள் பயன்பாட்டிற்கு ஒப்புதல் அளிக்கும் படி பரிந்துரைக்க கூடாது.
- அதே மாதிரி பகிர் – நீங்கள் ரீமிக்ஸ் செய்தாலோ, உருமாற்றம் செய்தாலோ அல்லது பொருளை உருவாக்கினாலோ, உங்கள் பங்களிப்புகளை அல்லது இணக்கமான உரிமம் கீழ் அசலாக விநியோகிக்க வேண்டும்.
கோப்பின் வரலாறு
குறித்த நேரத்தில் இருந்த படிமத்தைப் பார்க்க அந்நேரத்தின் மீது சொடுக்கவும்.
| நாள்/நேரம் | நகம் அளவு சிறுபடம் | அளவுகள் | பயனர் | கருத்து | |
|---|---|---|---|---|---|
| தற்போதைய | 21:32, 20 திசம்பர் 2023 | | 2,754 × 1,398 (1.24 MB) | JackintheBox | Updated as of 20 December |
| 22:26, 19 மே 2023 |  | 2,754 × 1,398 (1.24 MB) | JackintheBox | Updated with data as of 19 May | |
| 02:38, 7 மே 2023 |  | 2,754 × 1,398 (1.18 MB) | Alecnotalex | fixed guatemala 1122 -> 112 | |
| 01:34, 19 சனவரி 2023 |  | 2,754 × 1,398 (1.24 MB) | JackintheBox | Updated data as of 18 Jan | |
| 12:41, 22 செப்டெம்பர் 2022 |  | 2,754 × 1,398 (1.24 MB) | JackintheBox | Changed date on map to 20 Sep | |
| 23:49, 20 செப்டெம்பர் 2022 |  | 2,754 × 1,398 (1.24 MB) | JackintheBox | Updated map as of 20 September | |
| 19:50, 18 ஆகத்து 2022 |  | 2,754 × 1,398 (1.24 MB) | JackintheBox | Updated map as of 18 August | |
| 21:40, 15 சூலை 2022 |  | 2,754 × 1,398 (1.24 MB) | JackintheBox | Updated map as of 15 July | |
| 23:11, 25 சூன் 2022 |  | 2,754 × 1,398 (1.24 MB) | Longestview | {{current}} | |
| 20:59, 1 சூன் 2022 |  | 2,754 × 1,398 (1.22 MB) | JackintheBox | Updated shades and values for 1 Jun using Our World in Data |
கோப்பு பயன்பாடு
பின்வரும் பக்க இணைப்புகள் இப் படிமத்துக்கு இணைக்கபட்டுள்ளது(ளன):
கோப்பின் முழுமையான பயன்பாடு
கீழ்கண்ட மற்ற விக்கிகள் இந்த கோப்பை பயன்படுத்துகின்றன:
- ar.wikipedia.org-திட்டத்தில் இதன் பயன்பாடு
- azb.wikipedia.org-திட்டத்தில் இதன் பயன்பாடு
- az.wikipedia.org-திட்டத்தில் இதன் பயன்பாடு
- be.wikipedia.org-திட்டத்தில் இதன் பயன்பாடு
- bg.wikipedia.org-திட்டத்தில் இதன் பயன்பாடு
- bh.wikipedia.org-திட்டத்தில் இதன் பயன்பாடு
- bn.wikipedia.org-திட்டத்தில் இதன் பயன்பாடு
- bs.wikipedia.org-திட்டத்தில் இதன் பயன்பாடு
- bug.wikipedia.org-திட்டத்தில் இதன் பயன்பாடு
- ca.wikipedia.org-திட்டத்தில் இதன் பயன்பாடு
- ceb.wikipedia.org-திட்டத்தில் இதன் பயன்பாடு
- ckb.wikipedia.org-திட்டத்தில் இதன் பயன்பாடு
- cs.wikipedia.org-திட்டத்தில் இதன் பயன்பாடு
- cy.wikipedia.org-திட்டத்தில் இதன் பயன்பாடு
- el.wikipedia.org-திட்டத்தில் இதன் பயன்பாடு
- en.wikipedia.org-திட்டத்தில் இதன் பயன்பாடு
- 2020s in history
- COVID-19 pandemic
- COVID-19 pandemic by country and territory
- Wikipedia talk:WikiProject COVID-19/Archive 1
- Portal:COVID-19
- Wikipedia:WikiProject COVID-19/Case Count Task Force
- Talk:COVID-19 pandemic/Archive 24
- Wikipedia:Reference desk/Archives/Science/2020 May 20
- User:Investigatory/sandbox
- en.wikibooks.org-திட்டத்தில் இதன் பயன்பாடு
- et.wikipedia.org-திட்டத்தில் இதன் பயன்பாடு
- fa.wikipedia.org-திட்டத்தில் இதன் பயன்பாடு
- fr.wikipedia.org-திட்டத்தில் இதன் பயன்பாடு
- gl.wikipedia.org-திட்டத்தில் இதன் பயன்பாடு
- gv.wikipedia.org-திட்டத்தில் இதன் பயன்பாடு
- hif.wikipedia.org-திட்டத்தில் இதன் பயன்பாடு
- hi.wikipedia.org-திட்டத்தில் இதன் பயன்பாடு
- id.wikipedia.org-திட்டத்தில் இதன் பயன்பாடு
- it.wikipedia.org-திட்டத்தில் இதன் பயன்பாடு
- iu.wikipedia.org-திட்டத்தில் இதன் பயன்பாடு
- ja.wikipedia.org-திட்டத்தில் இதன் பயன்பாடு
- kab.wikipedia.org-திட்டத்தில் இதன் பயன்பாடு
- km.wikipedia.org-திட்டத்தில் இதன் பயன்பாடு
- kn.wikipedia.org-திட்டத்தில் இதன் பயன்பாடு
- la.wikipedia.org-திட்டத்தில் இதன் பயன்பாடு
- lt.wikipedia.org-திட்டத்தில் இதன் பயன்பாடு
- lv.wikipedia.org-திட்டத்தில் இதன் பயன்பாடு
- min.wikipedia.org-திட்டத்தில் இதன் பயன்பாடு
- ml.wikipedia.org-திட்டத்தில் இதன் பயன்பாடு
- mni.wikipedia.org-திட்டத்தில் இதன் பயன்பாடு
சிறப்பு பக்கம்-மொத்த பயன்பாடு - இதன் மூலம் இந்த கோப்பின் மொத்த பயன்பாட்டை அறிய முடியும்