
படிமம்:Number of prokaryotic genomes and sequencing costs.svg

Size of this PNG preview of this SVG file: 800 × 533 படப்புள்ளிகள். மற்ற பிரிதிறன்கள்: 320 × 213 படப்புள்ளிகள் | 640 × 427 படப்புள்ளிகள் | 1,024 × 683 படப்புள்ளிகள் | 1,280 × 853 படப்புள்ளிகள் | 2,560 × 1,707 படப்புள்ளிகள் | 1,350 × 900 படப்புள்ளிகள் .
மூலக்கோப்பு (SVG கோப்பு, பெயரளவில் 1,350 × 900 பிக்சல்கள், கோப்பு அளவு: 145 KB)
| இது விக்கிமீடியா பொதுக்கோப்பகத்தில் இருக்கும் ஒரு கோப்பாகும். இக்கோப்பைக் குறித்து அங்கே காணப்படும் படிம விளக்கப் பக்கத்தை இங்கே கீழே காணலாம்.
|
சுருக்கம்
| விளக்கம் |
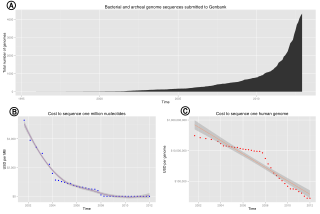
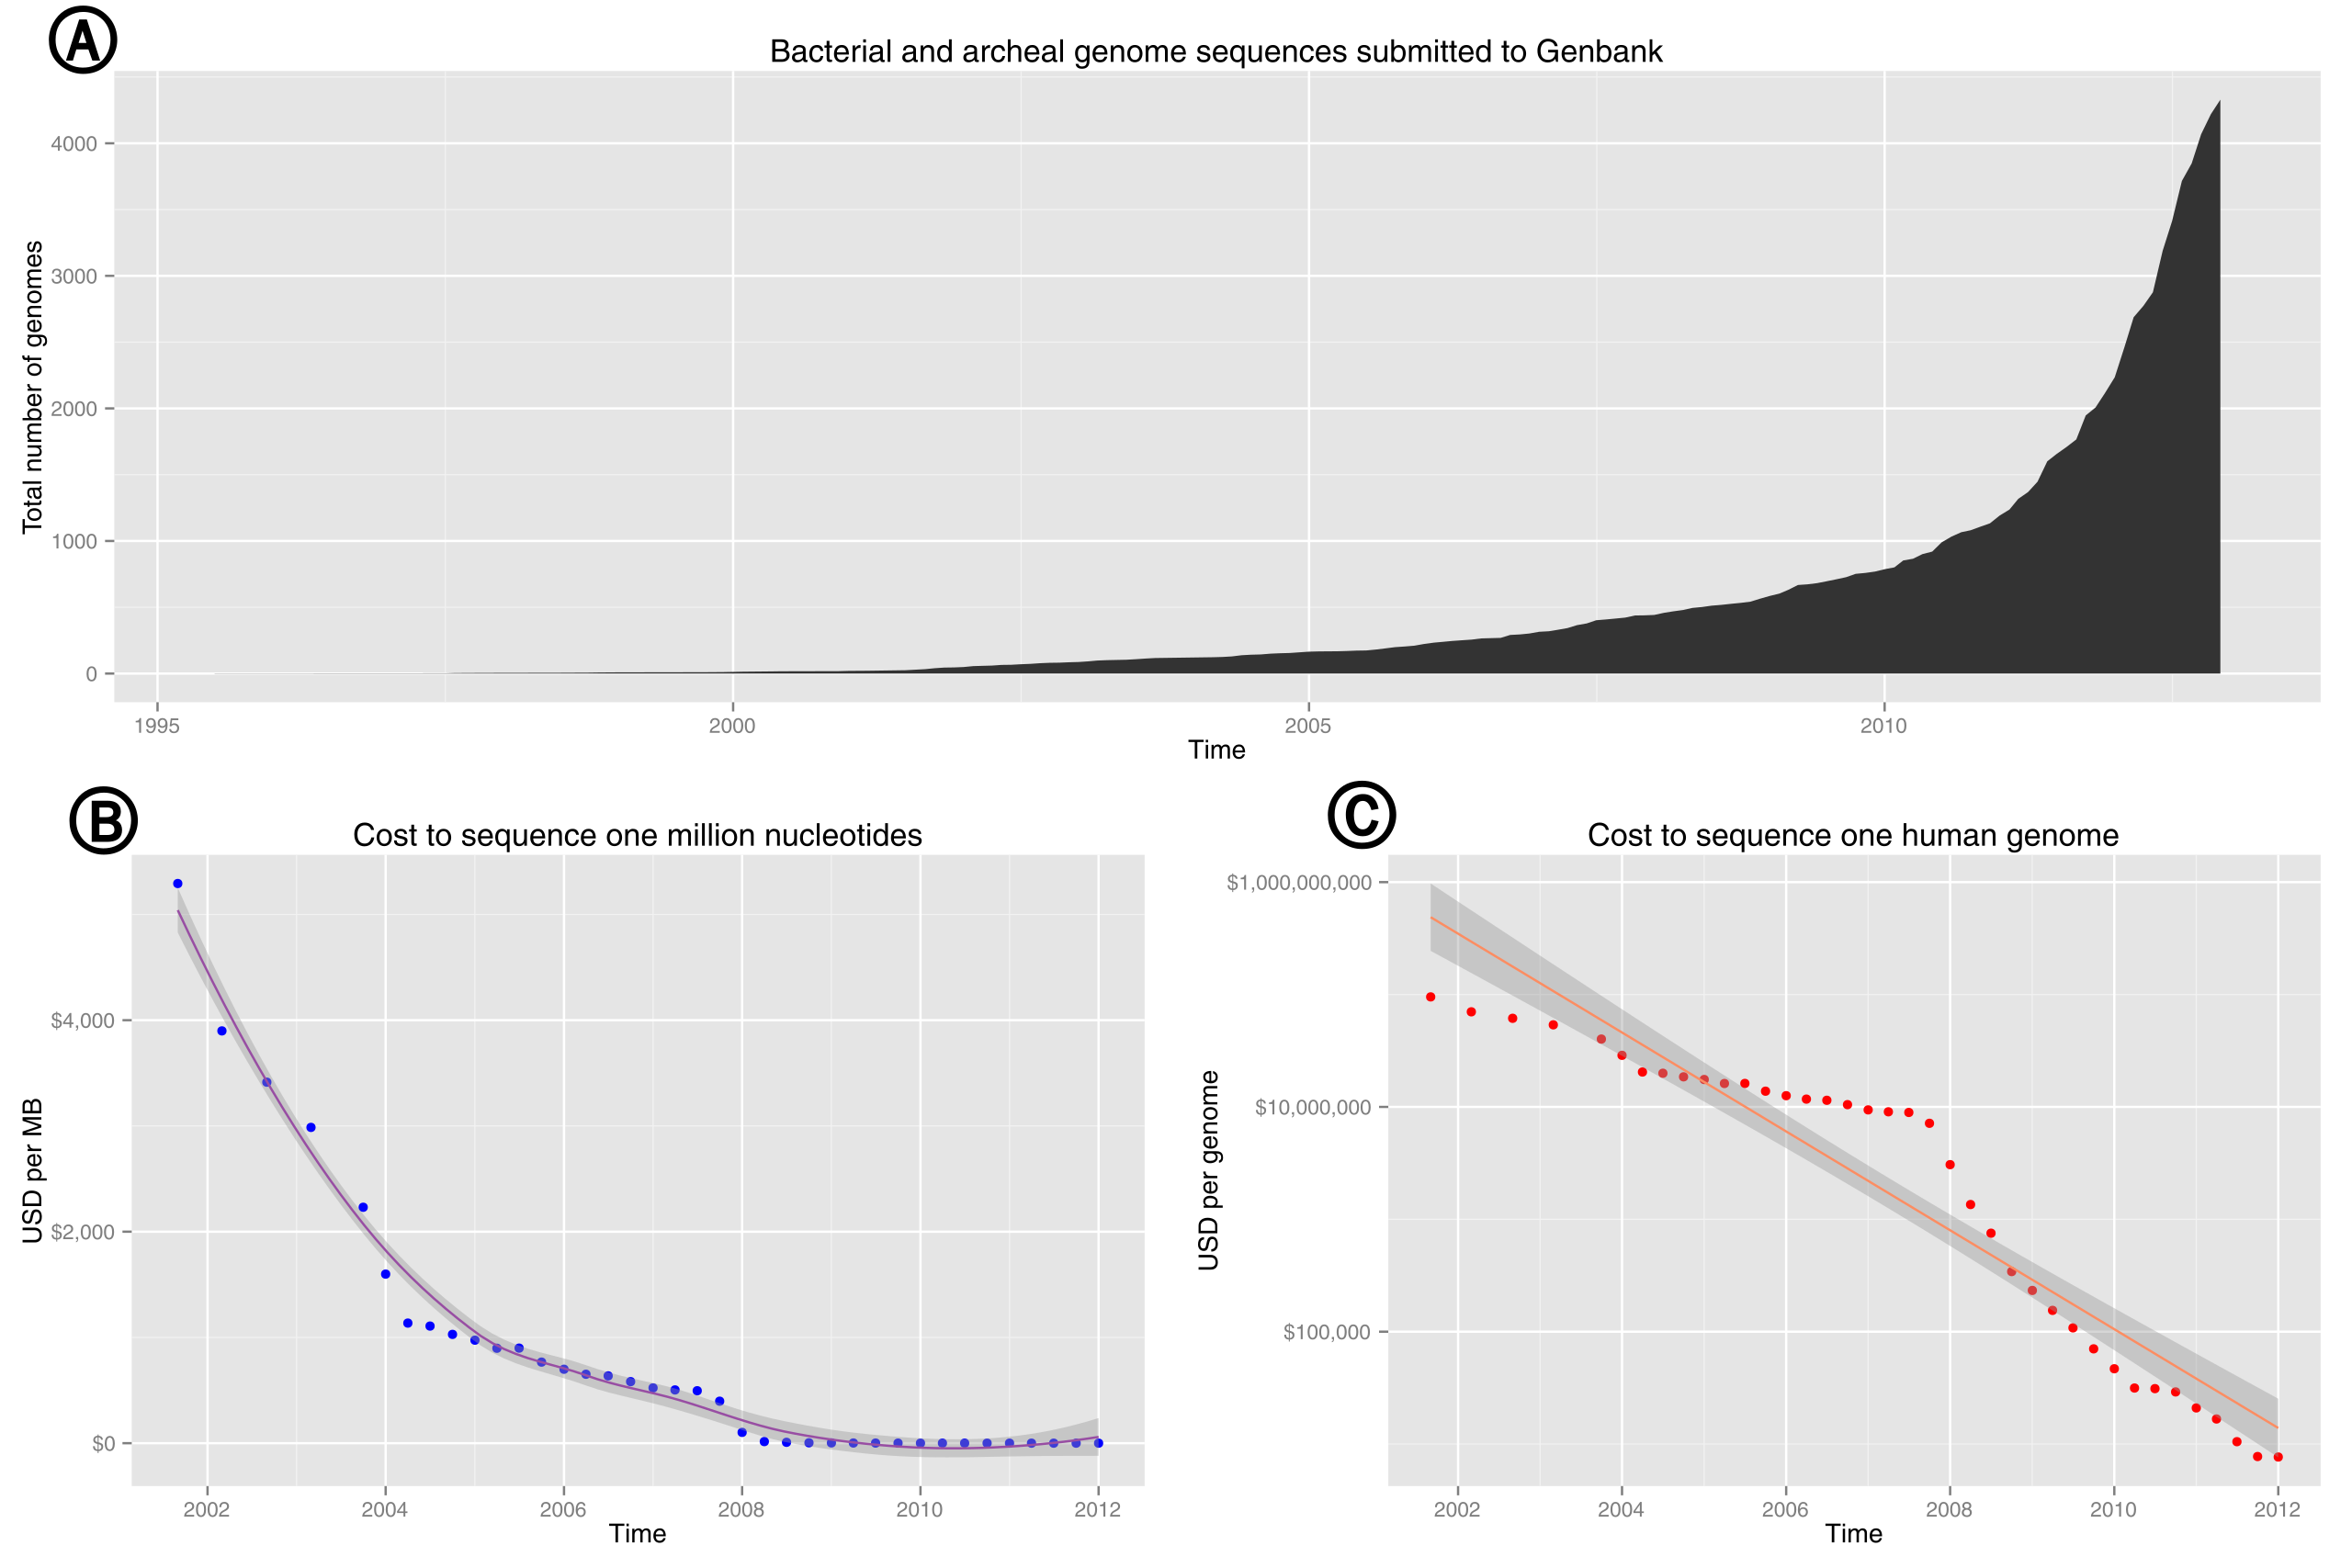
English: Plot of the total number of prokaryotic genomes submitted to Genbank as a function of time. Based on data from genome reports and genome.gov. Subfigures: (A) Exponential growth of genome sequence databases since 1995. (B) The cost in US Dollars (USD) to sequence one million bases. (C) The cost in USD to sequence a 3,000 Mb (human-sized) genome on a log10 transformed scale. |
| நாள் | |
| மூலம் | சொந்த முயற்சி |
| ஆசிரியர் | Estevezj |
| ஒத்தக்கோப்பு |
This file was derived from: Bacterial and archeal genome sequences submitted to Genbank.svg: |
| SVG genesis | |
| Source code | R code# Download our tables from NCBI's FTP site. Accessed 14:30PST, 18 December 2012
prok <- read.table("ftp://ftp.ncbi.nlm.nih.gov/genomes/GENOME_REPORTS/prokaryotes.txt", sep="\t", comment.char="!", header=T)
# Pull release dates, while dropping rows lacking a release date.
prok <- as.Date(prok$Release.Date[prok$Release.Date != '-'],format="%Y/%m/%d")
# Bin our dates by month and year, tabulate, and save to a dataframe.
prok.cut <- as.data.frame(
table(
as.Date(
cut(prok, "month")
)
)
)
# Correct our column titles, calculate a running total, and reconvert from factor to date
colnames(prok.cut) <- c("Date", "Total")
prok.cut$Total <- cumsum(prok.cut$Total)
prok.cut$Date <- as.Date(prok.cut$Date)
# DNA Sequencing Costs from NHGRI: http://www.genome.gov/sequencingcosts/
# Data from http://www.genome.gov/pages/der/sequencing_cost.pptx
# After munging the pptx, download the tables from pastebin. Accessed 12:42PST, 2012-12-20
seq.cost <- read.table("http://pastebin.com/raw.php?i=NA6c4i70", header=TRUE)
# Format the date.
seq.cost$Date <- as.Date(seq.cost$Date,format="%m-%d-%Y")
# Draw our plots
library("ggplot2")
library("grid")
library("scales")
(p <- ggplot(prok.cut, aes(Date, Total)) + geom_area() + ggtitle("Bacterial and archeal genome sequences submitted to Genbank") + xlab('Time') + ylab("Total number of genomes")
)
(mb <- ggplot(seq.cost, aes(Date, USD.per.Mb)) + geom_point(colour = "blue") +
stat_smooth(color="#984EA3")+
ggtitle("Cost to sequence one million nucleotides") +
xlab('Time') +
ylab("USD per MB") +
scale_y_continuous(labels = dollar)
)
(genome <- ggplot(seq.cost, aes(Date, USD.per.Genome)) + geom_point(colour = "red") +
stat_smooth(method='lm',color="#FC8D62")+
ggtitle("Cost to sequence one human genome") +
xlab('Time') +
ylab("USD per genome") +
scale_y_log10(labels = dollar)
)
# This part is based on Hadley's Ggplot2 book (doi:10.1007/978-0-387-98141-3_8)
# Save our plot to SVG
library(grDevices)
svg(filename='ncbi-genomes.svg', width = 15, height = 10)
grid.newpage()
pushViewport(viewport(layout = grid.layout(2, 2)))
vplayout <- function(x, y)
viewport(layout.pos.row = x, layout.pos.col = y)
print(p, vp = vplayout(1, 1:2))
print(mb, vp = vplayout(2, 1))
print(genome, vp = vplayout(2, 2))
dev.off()
|
அனுமதி
இந்த ஆக்கத்தின் காப்புரிமையாளரான நான் இதனைப் பின்வரும் உரிமத்தின் கீழ் வெளியிடுகின்றேன்:
இந்த கோப்பு Creative Commons Attribution-Share Alike 3.0 Unported உரிமத்தின் கீழ் உள்ளது.
- நீங்கள் சுதந்திரமாக:
- பகிர்ந்து கொள்ள – வேலையை நகலெடுக்க, விநியோகிக்க மற்றும் அனுப்ப
- மீண்டும் கலக்க – வேலைக்கு பழகிக்கொள்ள.
- கீழ்க்காணும் விதிகளுக்கு ஏற்ப,
- பண்புக்கூறுகள் – நீங்கள் பொருத்தமான உரிமையை வழங்க வேண்டும், உரிமத்திற்கான இணைப்பை வழங்க வேண்டும் மற்றும் மாற்றங்கள் செய்யப்பட்டிருந்தால் குறிப்பிட வேண்டும். நீங்கள் ஏற்புடைய எந்த முறையிலும் அவ்வாறு செய்யலாம், ஆனால் எந்த வகையிலும் உரிமதாரர் உங்களை அல்லது உங்கள் பயன்பாட்டிற்கு ஒப்புதல் அளிக்கும் படி பரிந்துரைக்க கூடாது.
- அதே மாதிரி பகிர் – நீங்கள் ரீமிக்ஸ் செய்தாலோ, உருமாற்றம் செய்தாலோ அல்லது பொருளை உருவாக்கினாலோ, உங்கள் பங்களிப்புகளை அல்லது இணக்கமான உரிமம் கீழ் அசலாக விநியோகிக்க வேண்டும்.

|
GNU Free Documentation License விதிமுறைகளின் கீழ் இந்த ஆவணத்தை நகலெடுக்க, விநியோகிக்க மற்றும்/அல்லது மாற்றுவதற்கு அனுமதி வழங்கப்பட்டுள்ளது, Free Software Foundation;ஆல் வெளியிடப்பட்ட பதிப்பு 1.2 அல்லது அதற்குப் பிந்தைய பதிப்பு, மாற்றமில்லாத பிரிவுகள், முன் அட்டை உரைகள் மற்றும் பின் அட்டை உரைகள் இல்லாமல் வெளியிடப்பட்டது. GNU Free Documentation License என்ற தலைப்பில் உரிமத்தின் நகல் சேர்க்கப்பட்டுள்ளது. |
நீர் உமக்கு விருப்பமான உரிமத்தை தேர்ந்தெடுக்கலாம்.
கோப்பின் வரலாறு
குறித்த நேரத்தில் இருந்த படிமத்தைப் பார்க்க அந்நேரத்தின் மீது சொடுக்கவும்.
| நாள்/நேரம் | நகம் அளவு சிறுபடம் | அளவுகள் | பயனர் | கருத்து | |
|---|---|---|---|---|---|
| தற்போதைய | 05:04, 21 திசம்பர் 2012 | | 1,350 × 900 (145 KB) | Estevezj | Added subplot labels. |
| 04:50, 21 திசம்பர் 2012 |  | 1,350 × 900 (107 KB) | Estevezj | {{Information |Description ={{en|1=Plot of the total number of prokaryotic genomes submitted to Genbank as a function of time. Based on data from [http://www.ncbi.nlm.nih.gov/genome genome reports] and [http://www.genome.gov/sequencingcosts/ genome.... |
கோப்பு பயன்பாடு
இப் படிமத்துக்கு இணைக்கப்பட்டுள்ள பக்கங்கள் எதுவும் இல்லை.
கோப்பின் முழுமையான பயன்பாடு
கீழ்கண்ட மற்ற விக்கிகள் இந்த கோப்பை பயன்படுத்துகின்றன:
- bs.wikipedia.org-திட்டத்தில் இதன் பயன்பாடு
- en.wikipedia.org-திட்டத்தில் இதன் பயன்பாடு
- id.wikipedia.org-திட்டத்தில் இதன் பயன்பாடு
- mk.wikipedia.org-திட்டத்தில் இதன் பயன்பாடு
- sr.wikipedia.org-திட்டத்தில் இதன் பயன்பாடு