
படிமம்:Simpson's paradox continuous.svg

Size of this PNG preview of this SVG file: 390 × 260 படப்புள்ளிகள். மற்ற பிரிதிறன்கள்: 320 × 213 படப்புள்ளிகள் | 640 × 427 படப்புள்ளிகள் | 1,024 × 683 படப்புள்ளிகள் | 1,280 × 853 படப்புள்ளிகள் | 2,560 × 1,707 படப்புள்ளிகள் .
மூலக்கோப்பு (SVG கோப்பு, பெயரளவில் 390 × 260 பிக்சல்கள், கோப்பு அளவு: 18 KB)
| இது விக்கிமீடியா பொதுக்கோப்பகத்தில் இருக்கும் ஒரு கோப்பாகும். இக்கோப்பைக் குறித்து அங்கே காணப்படும் படிம விளக்கப் பக்கத்தை இங்கே கீழே காணலாம்.
|
W3C-validity not checked.
சுருக்கம்
| விளக்கம் |
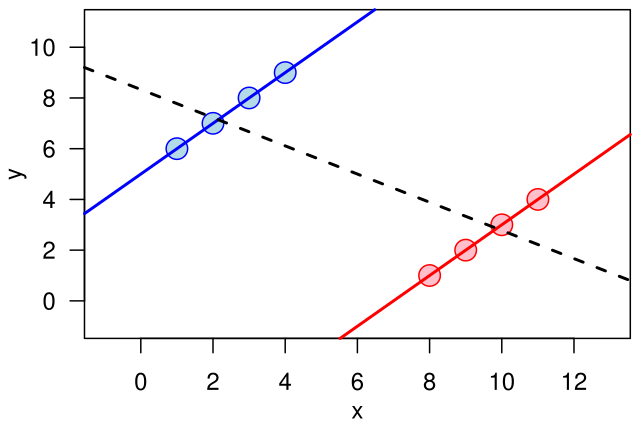
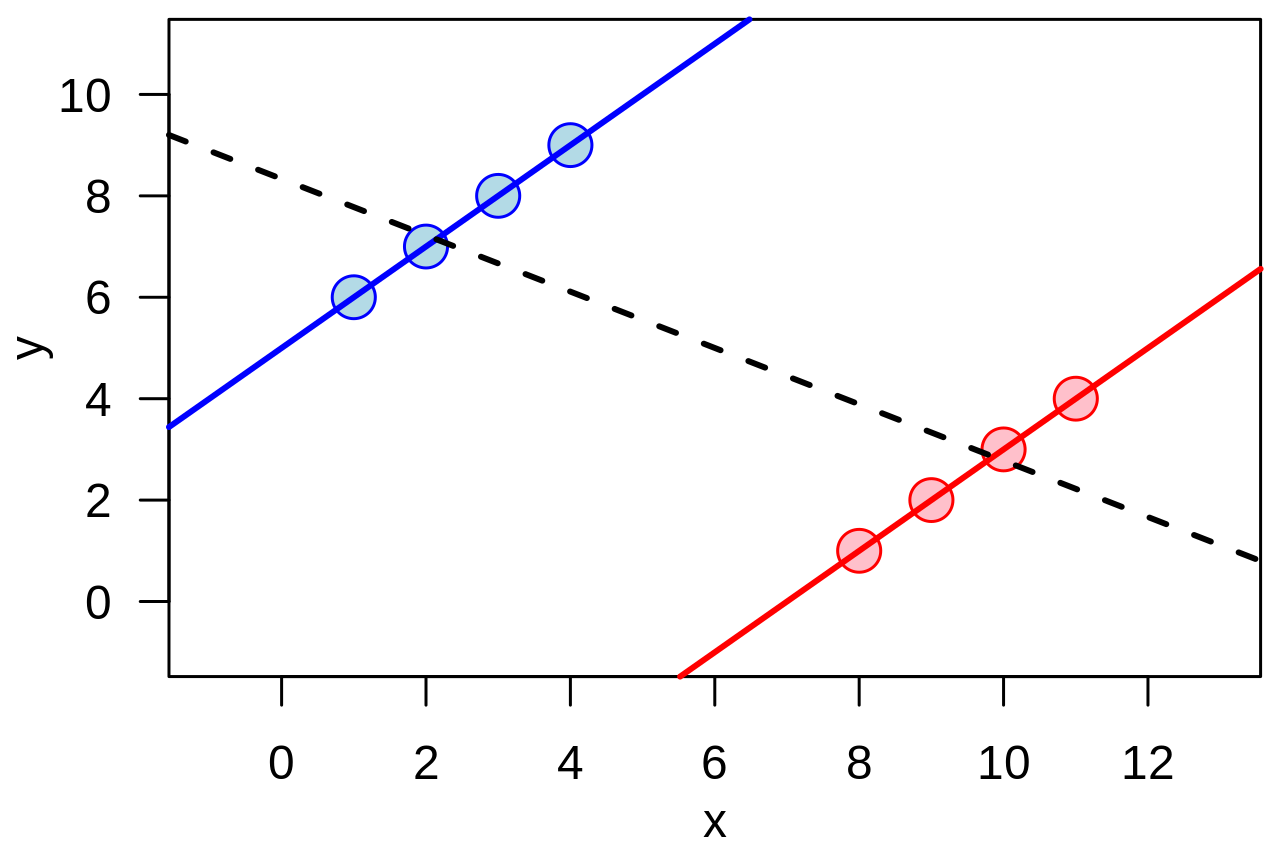
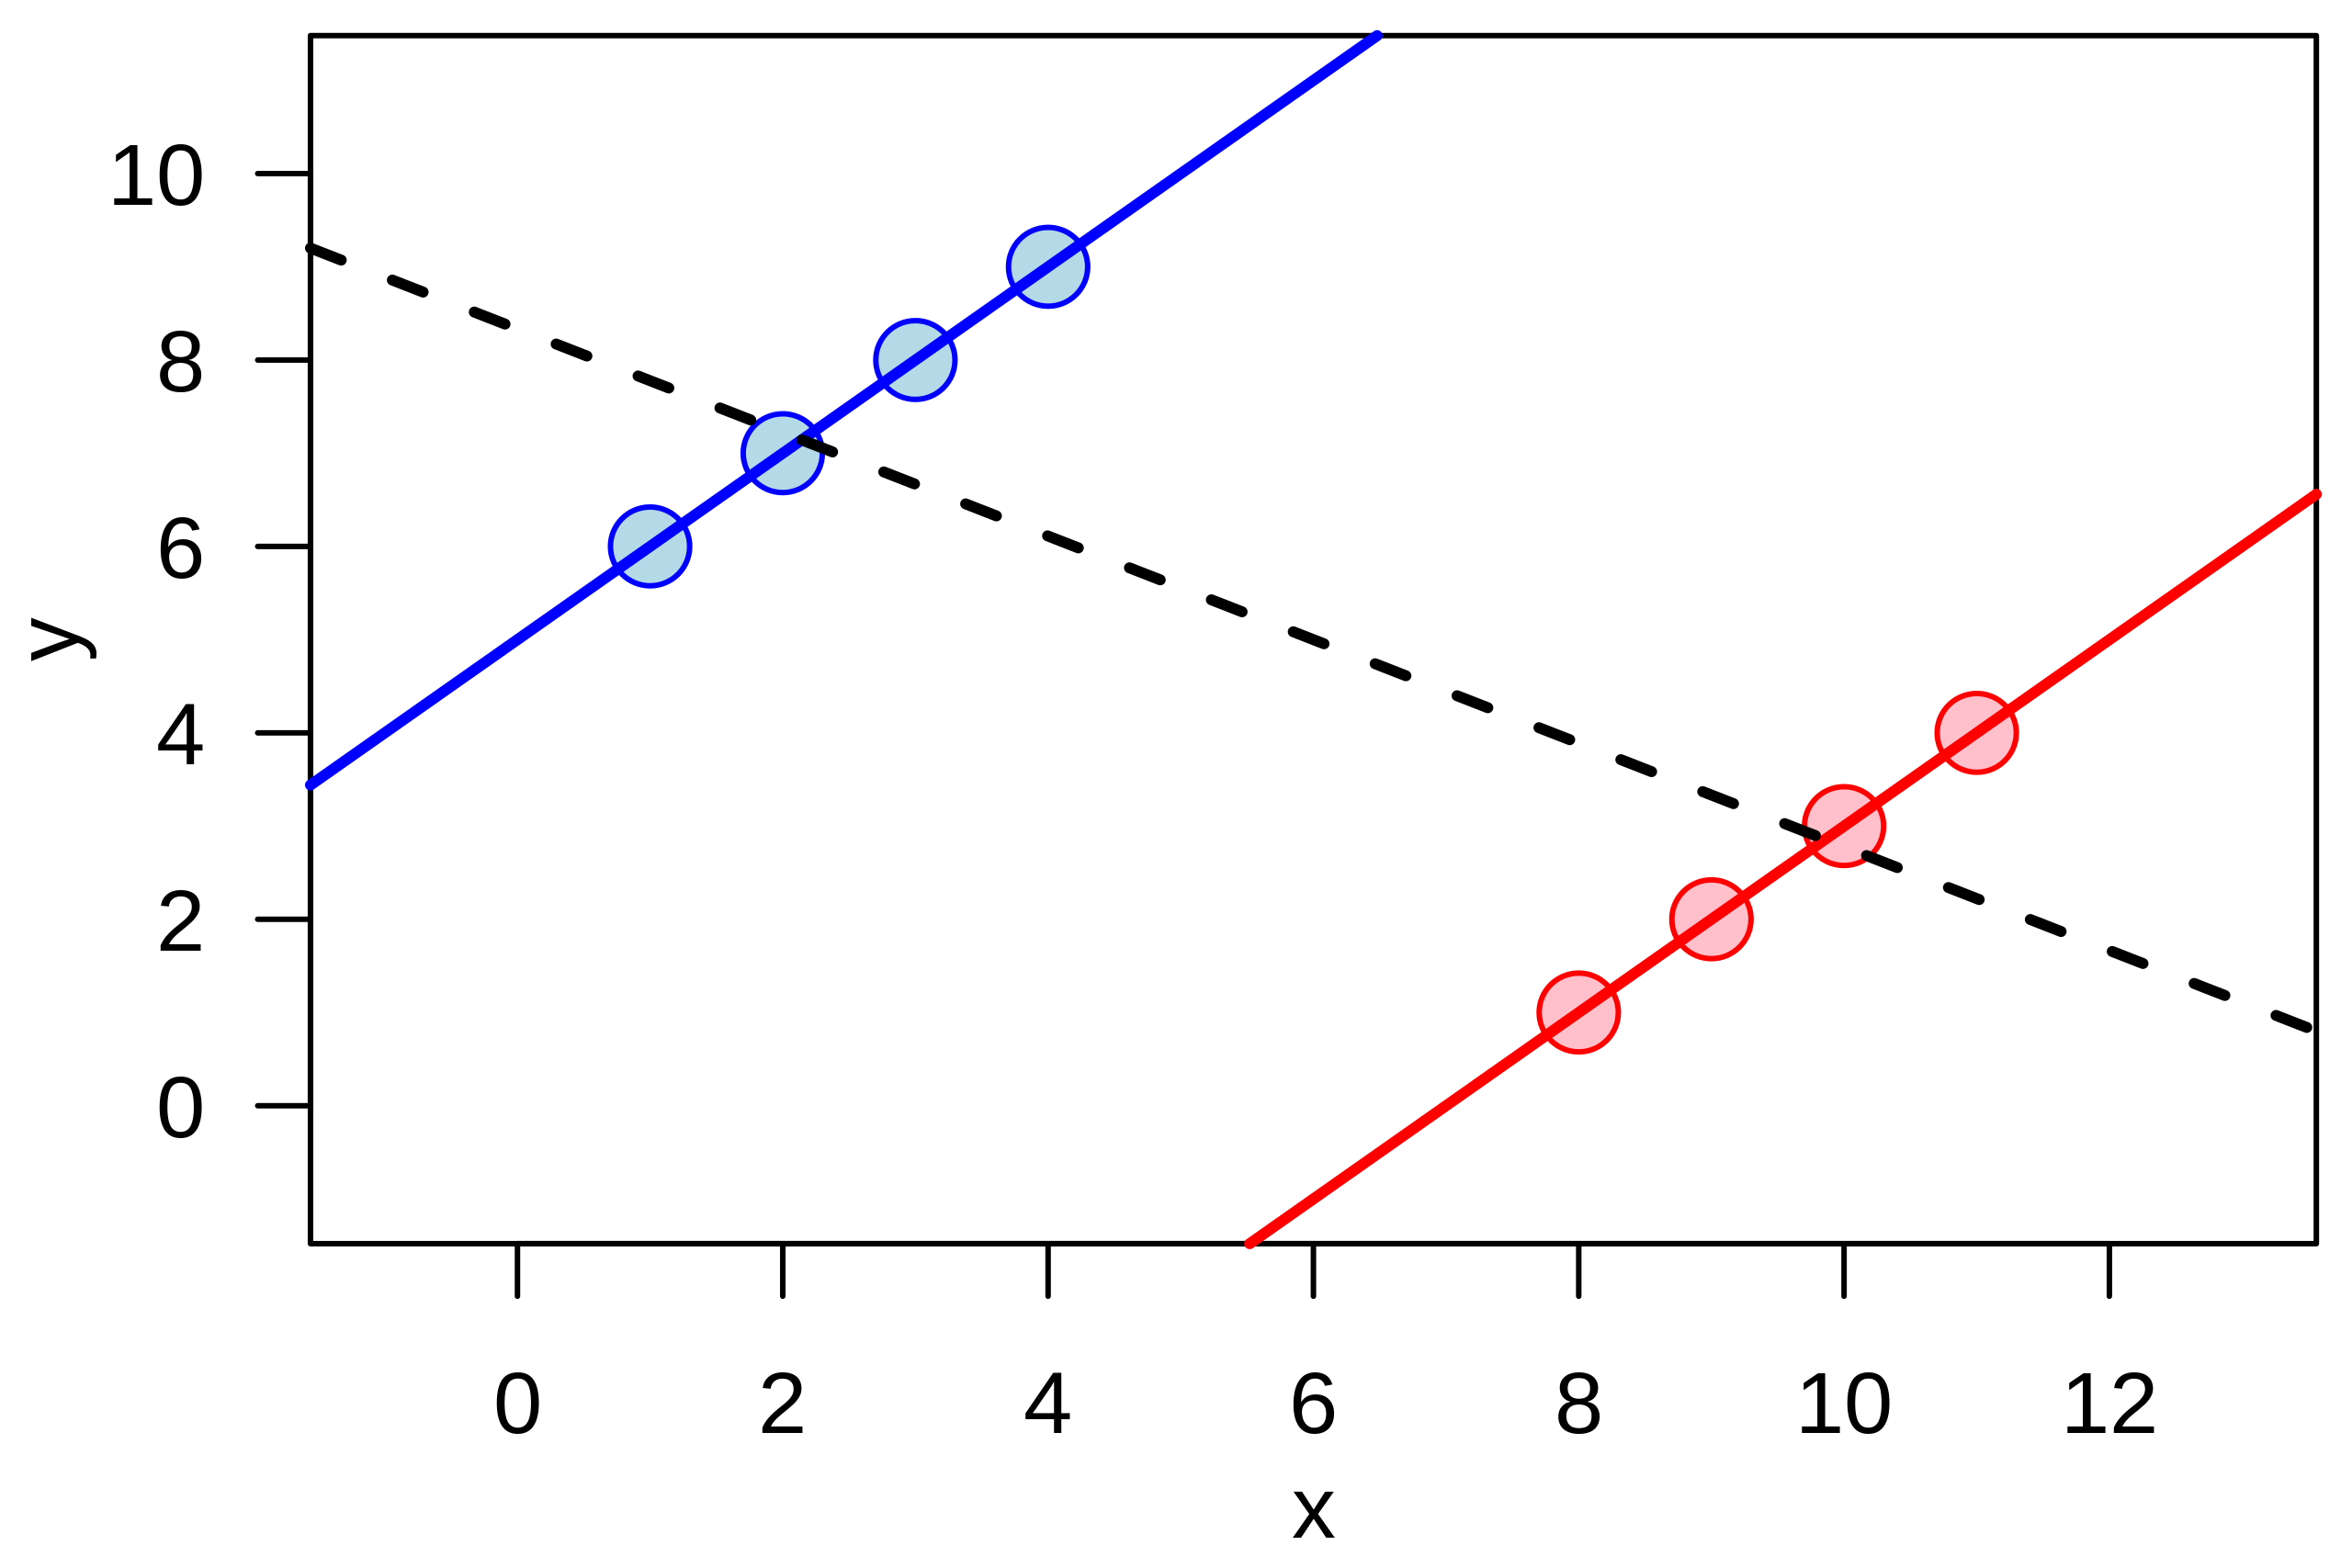
English: Illustration of the quantitative version of en:Simpson's paradox: a positive trend appears for two separate groups (blue and red), whereas a negative trend (black, dashed) appears when the groups are combined. |
| நாள் | |
| மூலம் | சொந்த முயற்சி |
| ஆசிரியர் | Schutz |
Example of the quantitative version of w:Simpson's paradox.
The graphic was created by User:Schutz for Wikipedia on 14 June 2007, using the R statistical project. The program that generated and exported the graphic is given below; the uploaded version was generated slightly differently to workaround a bug during the PS to SVG conversion with pstoedit command. The layout was slightly modified using Inkscape before upload.
  x1 <- c(1,2,3,4)
  y1 <- x1 + 5

  x2 <- x1 + 7
  y2 <- x2 - 7

  x <- c(x1,x2)
  y <- c(y1,y2)

  postscript("simpson.eps", paper="special", width=4.5, height=3)

  par(las=1)
  par(mar=c(3,3,0.5,0.5))
  par(mgp=c(2,1,0))

  plot(x,y, cex=2, pch=21,
       col=rep(c("blue", "red"), each=4), bg=rep(c("lightblue", "pink"), each=4),
       xlim=range(x)+c(-2,2), ylim=range(y)+c(-2,2))
  abline(lm(y1 ~ x1), col="blue", lwd=2)
  abline(lm(y2 ~ x2), col="red", lwd=2)
  abline(lm(y  ~ x), lwd=2, lty=2)

  dev.off()
அனுமதி
| This work has been released into the public domain by its author, I, Schutz. This applies worldwide. சில நாடுகளில் இது சாத்தியமில்லாது போகலாம். அவ்வாறாயின் : I, Schutz grants anyone the right to use this work for any purpose, without any conditions, unless such conditions are required by law. |
கோப்பின் வரலாறு
குறித்த நேரத்தில் இருந்த படிமத்தைப் பார்க்க அந்நேரத்தின் மீது சொடுக்கவும்.
| நாள்/நேரம் | நகம் அளவு சிறுபடம் | அளவுகள் | பயனர் | கருத்து | |
|---|---|---|---|---|---|
| தற்போதைய | 23:15, 13 சூன் 2007 | | 390 × 260 (18 KB) | Schutz | {{Information |Description=Illustration of the continuous version of Simpson's paradox |Source=self-made |Date=14 June 2007 |Author=Schutz }} Example of the continuous version of w:Simpson's paradox. The graphic was created by [[User |
கோப்பு பயன்பாடு
பின்வரும் 3 பக்கங்கள் இணைப்பு இப் படிமத்துக்கு இணைக்கபட்டுள்ளது(ளன):
கோப்பின் முழுமையான பயன்பாடு
கீழ்கண்ட மற்ற விக்கிகள் இந்த கோப்பை பயன்படுத்துகின்றன:
- ar.wikipedia.org-திட்டத்தில் இதன் பயன்பாடு
- ca.wikipedia.org-திட்டத்தில் இதன் பயன்பாடு
- cs.wikipedia.org-திட்டத்தில் இதன் பயன்பாடு
- cy.wikipedia.org-திட்டத்தில் இதன் பயன்பாடு
- de.wikipedia.org-திட்டத்தில் இதன் பயன்பாடு
- en.wikipedia.org-திட்டத்தில் இதன் பயன்பாடு
- es.wikipedia.org-திட்டத்தில் இதன் பயன்பாடு
- eu.wikipedia.org-திட்டத்தில் இதன் பயன்பாடு
- fi.wikipedia.org-திட்டத்தில் இதன் பயன்பாடு
- fr.wikipedia.org-திட்டத்தில் இதன் பயன்பாடு
- he.wikipedia.org-திட்டத்தில் இதன் பயன்பாடு
- ko.wikipedia.org-திட்டத்தில் இதன் பயன்பாடு
- nl.wikipedia.org-திட்டத்தில் இதன் பயன்பாடு
- no.wikipedia.org-திட்டத்தில் இதன் பயன்பாடு
- pl.wikipedia.org-திட்டத்தில் இதன் பயன்பாடு
- pt.wikipedia.org-திட்டத்தில் இதன் பயன்பாடு
- ru.wikipedia.org-திட்டத்தில் இதன் பயன்பாடு
- sk.wikipedia.org-திட்டத்தில் இதன் பயன்பாடு
- uk.wikipedia.org-திட்டத்தில் இதன் பயன்பாடு
- vi.wikipedia.org-திட்டத்தில் இதன் பயன்பாடு
- www.wikidata.org-திட்டத்தில் இதன் பயன்பாடு
- zh.wikipedia.org-திட்டத்தில் இதன் பயன்பாடு