படிமம்:Global Warming Predictions Map.jpg
Global_Warming_Predictions_Map.jpg (559 × 408 படவணுக்கள், கோப்பின் அளவு: 90 KB, MIME வகை: image/jpeg)
கோப்பின் வரலாறு
குறித்த நேரத்தில் இருந்த படிமத்தைப் பார்க்க அந்நேரத்தின் மீது சொடுக்கவும்.
| நாள்/நேரம் | நகம் அளவு சிறுபடம் | அளவுகள் | பயனர் | கருத்து | |
|---|---|---|---|---|---|
| தற்போதைய | 14:43, 10 நவம்பர் 2007 |  | 559 × 408 (90 KB) | Toony | {{Information |Description=Global_Warming_Predictions_Map |Source=gwart |Date= |Author=GWart |Permission= |other_versions= }} |
| 14:40, 10 நவம்பர் 2007 |  | 559 × 408 (90 KB) | Toony | {{Information |Description=Global_Warming_Predictions_Map. |Source=GWART |Date= |Author=GWART |Permission= |other_versions= }} | |
| 14:36, 10 நவம்பர் 2007 |  | 559 × 408 (45 KB) | Toony | {{Information |Description=Global_Warming_Predictions_Map_fr |Source=GWART[http://www.globalwarmingart.com/wiki/Image:Global_Warming_Predictions_Map_jpg] |Date=nov 2007 |Author=GWART |Permission= |other_versions= }} | |
| 08:20, 24 செப்டெம்பர் 2006 |  | 559 × 408 (90 KB) | Nils Simon | ||
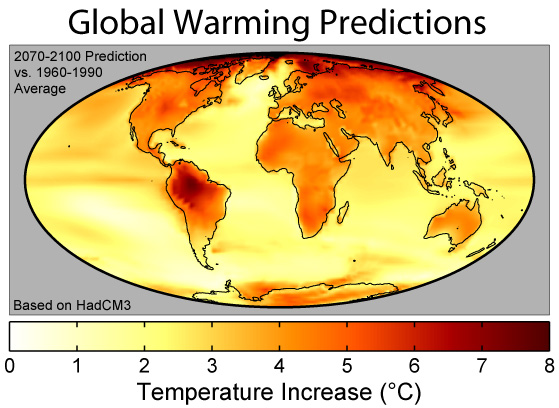
| 06:55, 10 ஏப்பிரல் 2006 |  | 559 × 408 (90 KB) | Pflatau | == Summary == thumb|right|250px|A comparison of predictions of global warming from 8 different climate models assuming the [[SRES A2 emissions scenario.]] This figure shows the predicted distribution of [[temperat |
கோப்பு பயன்பாடு
இப் படிமத்துக்கு இணைக்கப்பட்டுள்ள பக்கங்கள் எதுவும் இல்லை.
கோப்பின் முழுமையான பயன்பாடு
கீழ்கண்ட மற்ற விக்கிகள் இந்த கோப்பை பயன்படுத்துகின்றன:
- azb.wikipedia.org-திட்டத்தில் இதன் பயன்பாடு
- az.wiktionary.org-திட்டத்தில் இதன் பயன்பாடு
- bg.wikipedia.org-திட்டத்தில் இதன் பயன்பாடு
- de.wikipedia.org-திட்டத்தில் இதன் பயன்பாடு
- el.wikipedia.org-திட்டத்தில் இதன் பயன்பாடு
- en.wikipedia.org-திட்டத்தில் இதன் பயன்பாடு
- 2000s
- User:Dragons flight/Images
- Wikipedia:Today's featured article/June 2006
- Wikipedia:Today's featured article/June 21, 2006
- User:UBeR/GWcleanup
- User:Camacan
- User:Camacan/userboxes/User Global Warming
- Wikipedia:Reference desk/Archives/Science/2009 February 21
- Key events of the 20th century
- User:Mytwocents/Globalnull Warmingnull
- Wikipedia:Village pump (technical)/Archive K
- User:Phoenix B 1of3/UBX Global Warming
- User:Aymdaman777
- Migration of marine species in the Northern Atlantic Ocean
- Post-Western era
- en.wikinews.org-திட்டத்தில் இதன் பயன்பாடு
- Kyoto Protocol comes into effect
- Wikinews:Template messages/Infoboxes
- British scientists claim 2005 warmest yet in Northern Hemisphere
- Australian Labor Party announces new Climate Change Policy
- Australian government says technology could reduce emissions three times more than Kyoto
- US senators on Greenland tour
- People rally worldwide for action against climate change
- World climate conference in Nairobi
- IEA warns: bleak future for the World without more energy investment
- Template:Climate change
- Scientist: Sulfur remedy for greenhouse effect backed by data
- Warming oceans make it harder for fish to breathe
- New Zealand Green party rates other parties on climate change policies
- Study: Arctic ice could be gone by 2020
- Climate campaigners scale UK Parliament and hang protest banners from the building
- EU, US declare intent to cooperate on climate change at summit
- G8 leaders set new emissions target
- Hopes for treaty on climate begin to wither
- Erosion influences Nigerian climate policy
- Scientists: Snow on Mt. Kilimanjaro to melt in twenty years
- Public access to information on emissions from European industries
- IPCC claims about Himalayan glaciers were not based on science
- Healing ozone layer may contribute to global warming
- IPCC chief refuses to apologize for glacier error
- Template:Infobox/lookup/Climate change
- Glasgow Climate Pact deal struck; nations to reduce coal usage
- Study: floods, droughts more intense in past 20 years due to higher global temperatures
- Heatwaves surge worldwide as researchers' analysis indicates global temperatures reaching new highs
- en.wikiversity.org-திட்டத்தில் இதன் பயன்பாடு
சிறப்பு பக்கம்-மொத்த பயன்பாடு - இதன் மூலம் இந்த கோப்பின் மொத்த பயன்பாட்டை அறிய முடியும்


