
படிமம்:Piecharts.svg

மூலக்கோப்பு (SVG கோப்பு, பெயரளவில் 689 × 494 பிக்சல்கள், கோப்பு அளவு: 39 KB)
| இது விக்கிமீடியா பொதுக்கோப்பகத்தில் இருக்கும் ஒரு கோப்பாகும். இக்கோப்பைக் குறித்து அங்கே காணப்படும் படிம விளக்கப் பக்கத்தை இங்கே கீழே காணலாம்.
|
சுருக்கம்
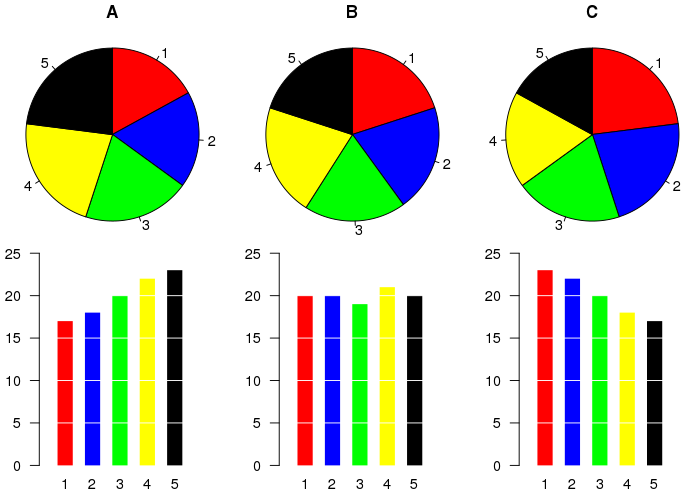
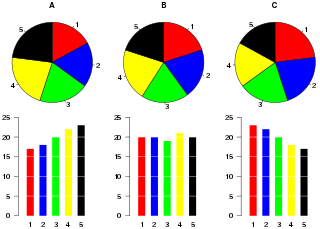
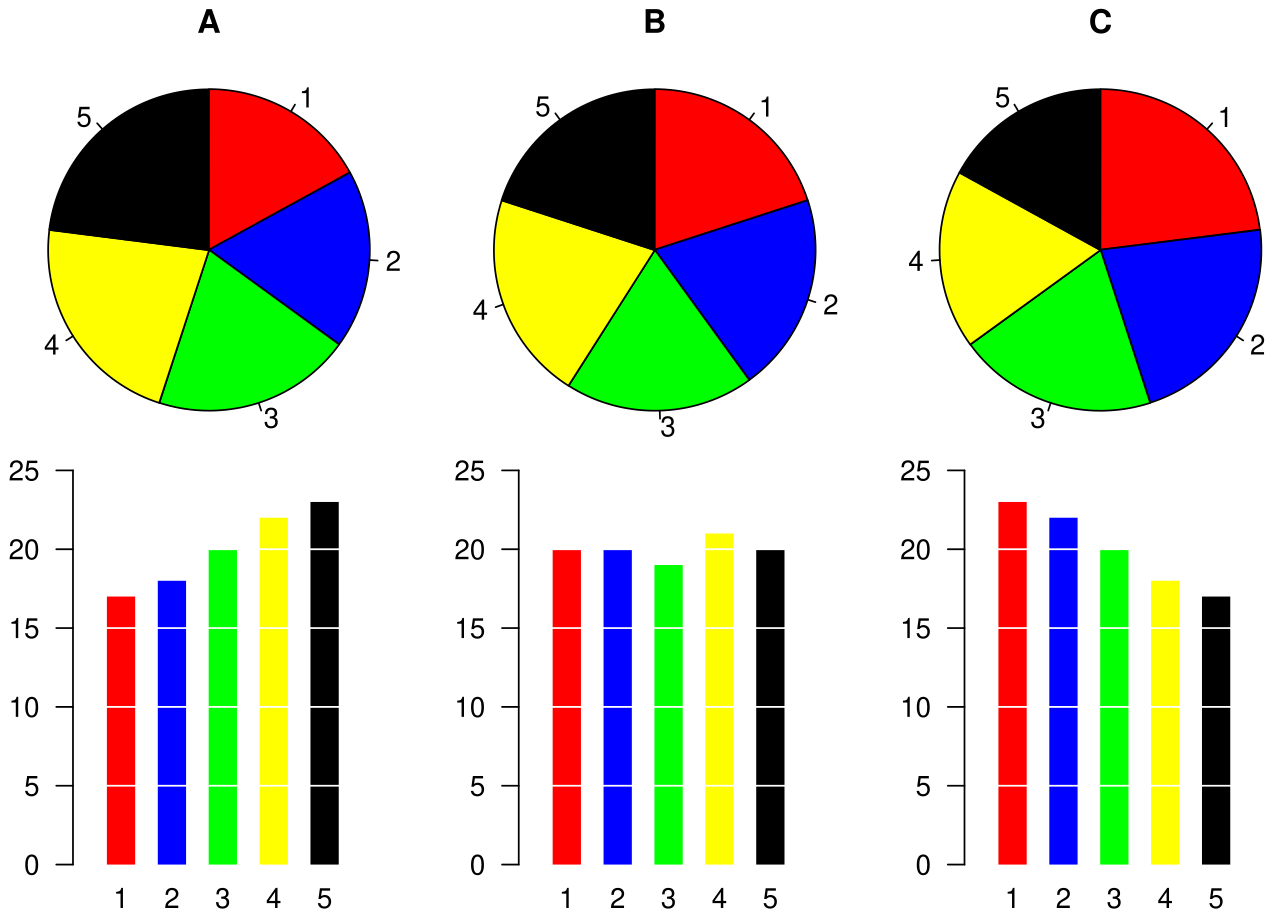
Example of a pie chart, along with a bar plot showing the same data and indicating that the pie chart is not the best possible chart for this particular dataset.
The graphic was created by User:Schutz for Wikipedia on 28 August 2007 using the R statistical project. The program that generated the graphic is given below. The graph was exported in postscript format, converted to SVG using the pstoedit command, and the layout was slightly modified using Inkscape before upload.
அனுமதி
- நீங்கள் சுதந்திரமாக:
- பகிர்ந்து கொள்ள – வேலையை நகலெடுக்க, விநியோகிக்க மற்றும் அனுப்ப
- மீண்டும் கலக்க – வேலைக்கு பழகிக்கொள்ள.
- கீழ்க்காணும் விதிகளுக்கு ஏற்ப,
- பண்புக்கூறுகள் – நீங்கள் பொருத்தமான உரிமையை வழங்க வேண்டும், உரிமத்திற்கான இணைப்பை வழங்க வேண்டும் மற்றும் மாற்றங்கள் செய்யப்பட்டிருந்தால் குறிப்பிட வேண்டும். நீங்கள் ஏற்புடைய எந்த முறையிலும் அவ்வாறு செய்யலாம், ஆனால் எந்த வகையிலும் உரிமதாரர் உங்களை அல்லது உங்கள் பயன்பாட்டிற்கு ஒப்புதல் அளிக்கும் படி பரிந்துரைக்க கூடாது.
கோப்பின் வரலாறு
குறித்த நேரத்தில் இருந்த படிமத்தைப் பார்க்க அந்நேரத்தின் மீது சொடுக்கவும்.
| நாள்/நேரம் | நகம் அளவு சிறுபடம் | அளவுகள் | பயனர் | கருத்து | |
|---|---|---|---|---|---|
| தற்போதைய | 08:33, 28 ஆகத்து 2007 | | 689 × 494 (39 KB) | Schutz | == Summary == Example of a pie chart, along with a bar plot showing the same data and indicating that the pie chart is not the best possible chart for this particular dataset. The graphic was created by User:Schutz for Wikipedia on 28 August 2007 usi |
கோப்பு பயன்பாடு
பின்வரும் பக்க இணைப்புகள் இப் படிமத்துக்கு இணைக்கபட்டுள்ளது(ளன):
கோப்பின் முழுமையான பயன்பாடு
கீழ்கண்ட மற்ற விக்கிகள் இந்த கோப்பை பயன்படுத்துகின்றன:
- cy.wikipedia.org-திட்டத்தில் இதன் பயன்பாடு
- el.wikipedia.org-திட்டத்தில் இதன் பயன்பாடு
- en.wikipedia.org-திட்டத்தில் இதன் பயன்பாடு
- eu.wikipedia.org-திட்டத்தில் இதன் பயன்பாடு
- fi.wikipedia.org-திட்டத்தில் இதன் பயன்பாடு
- he.wikipedia.org-திட்டத்தில் இதன் பயன்பாடு
- he.wikibooks.org-திட்டத்தில் இதன் பயன்பாடு
- ja.wikipedia.org-திட்டத்தில் இதன் பயன்பாடு
- pl.wikipedia.org-திட்டத்தில் இதன் பயன்பாடு
- pt.wikipedia.org-திட்டத்தில் இதன் பயன்பாடு
- tr.wikipedia.org-திட்டத்தில் இதன் பயன்பாடு
- uk.wikipedia.org-திட்டத்தில் இதன் பயன்பாடு
- zh.wikipedia.org-திட்டத்தில் இதன் பயன்பாடு