
படிமம்:Chris Gayle Graph.png

இந்த முன்னோட்டத்தின் அளவு: 800 × 466 படப்புள்ளிகள் . மற்ற பிரிதிறன்கள்: 320 × 186 படப்புள்ளிகள் | 640 × 373 படப்புள்ளிகள் | 986 × 574 படப்புள்ளிகள் .
மூலக்கோப்பு (986 × 574 படவணுக்கள், கோப்பின் அளவு: 5 KB, MIME வகை: image/png)
| இது விக்கிமீடியா பொதுக்கோப்பகத்தில் இருக்கும் ஒரு கோப்பாகும். இக்கோப்பைக் குறித்து அங்கே காணப்படும் படிம விளக்கப் பக்கத்தை இங்கே கீழே காணலாம்.
|
சுருக்கம்
| விளக்கம் |
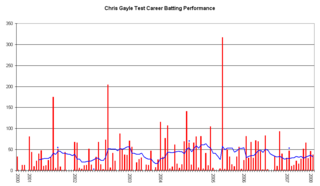
English: This graph details the Test Match performance of Chris Gayle. It was created by Raven4x4x. The red bars indicate the player's test match innings, while the blue line shows the average of the ten most recent innings at that point. Note that this average cannot be calculated for the first nine innings. The blue dots indicate innings in which Gayle finished not-out.
This graph was generated with Microsoft Excel 2002, using data from Cricinfo [1] and Howstat [2]. The information in this chart is current as of 28 January 2008. |
| நாள் | 2 திசம்பர் 2005 (original upload date) |
| மூலம் |
சொந்த முயற்சி Transferred from en.wikipedia |
| ஆசிரியர் | Raven4x4x at en.wikipedia |
அனுமதி
| |
This work has been released into the public domain by its author, Raven4x4x, at the ஆங்கிலம் விக்கிப்பீடியா project. This applies worldwide. In case this is not legally possible: |
Original upload log
The original description page was here. All following user names refer to en.wikipedia.
- 2005-12-02 02:45 Raven4x4x 963×492 (5580 bytes) This graph details the [[Test cricket|Test Match]] performance of [[Chris Gayle]]. It was created by [[User:Raven4x4x|Raven4x4x]]. The red bars indicate the player's test match innings, while the blue line shows the [[Batting average|average]] of the ten
- 2006-04-23 04:29 Raven4x4x 957×539 (5809 bytes) updated graph
- 2006-07-03 06:17 Raven4x4x 963×492 (5767 bytes) updated.The information in this graph is current as of 3 July 2006.
- 2006-12-03 00:01 Raven4x4x 986×540 (5052 bytes) Updated: The information in this graph is current as of 3 December 2006
- 2007-06-20 07:33 Raven4x4x 986×574 (5416 bytes) Updated: The information in this chart is current as of 20 June 2007.
- 2008-01-28 00:36 Raven4x4x 986×574 (5393 bytes) Updated: The information in this chart is current as of 28 January 2008.
கோப்பின் வரலாறு
குறித்த நேரத்தில் இருந்த படிமத்தைப் பார்க்க அந்நேரத்தின் மீது சொடுக்கவும்.
| நாள்/நேரம் | நகம் அளவு சிறுபடம் | அளவுகள் | பயனர் | கருத்து | |
|---|---|---|---|---|---|
| தற்போதைய | 21:19, 27 சூலை 2010 | | 986 × 574 (5 KB) | MGA73bot2 | == {{int:filedesc}} == {{Information |description={{en|1=This graph details the Test Match performance of Chris Gayle. It was created by Raven4x4x. The red bars indicate the player's test mat |
கோப்பு பயன்பாடு
இப் படிமத்துக்கு இணைக்கப்பட்டுள்ள பக்கங்கள் எதுவும் இல்லை.
கோப்பின் முழுமையான பயன்பாடு
கீழ்கண்ட மற்ற விக்கிகள் இந்த கோப்பை பயன்படுத்துகின்றன:
- en.wikipedia.org-திட்டத்தில் இதன் பயன்பாடு
- hi.wikipedia.org-திட்டத்தில் இதன் பயன்பாடு